Creation of a Digital Elevation Surface Using Critical Thinking Skills and Improvised Survey Techniques
Introduction
The purpose of this exercise was to better understand the necessary steps to survey a landscape and develop a terrain. We were given no directions to develop our terrain and no directions of how to record our results. Each group was given access to a supply of thumb tacks, yarn, and meter sticks. We were supposed to develop our terrain containing a ridge, hill, depression, valley, and plain. Finally, we needed to come up with a method to determine the elevation of the terrain we developed.
Our study was conducted using a planter box in the courtyard of Phillips Hall at the University of Wisconsin-Eau Claire on Friday, January 30, 2015. The medium used to sculpt our terrain was snow. The temperature was around -9° Celsius and conditions were overcast with winds out of the southwest at three miles per hour. The study was conducted between 11:00am-1:00pm. My group was composed of Galen Keily, Michael Bomber, and Kiernan Johnson, Jacob Henden,
Methods
The first step was to develop our terrain. We first sketched out our terrain on a piece of paper and then used that plan to dig our terrain out within the planter box. Snow was added to the planter box, the ground was leveled, and the terrain we had sketched was sculpted into the landscape (Figures 1-3).
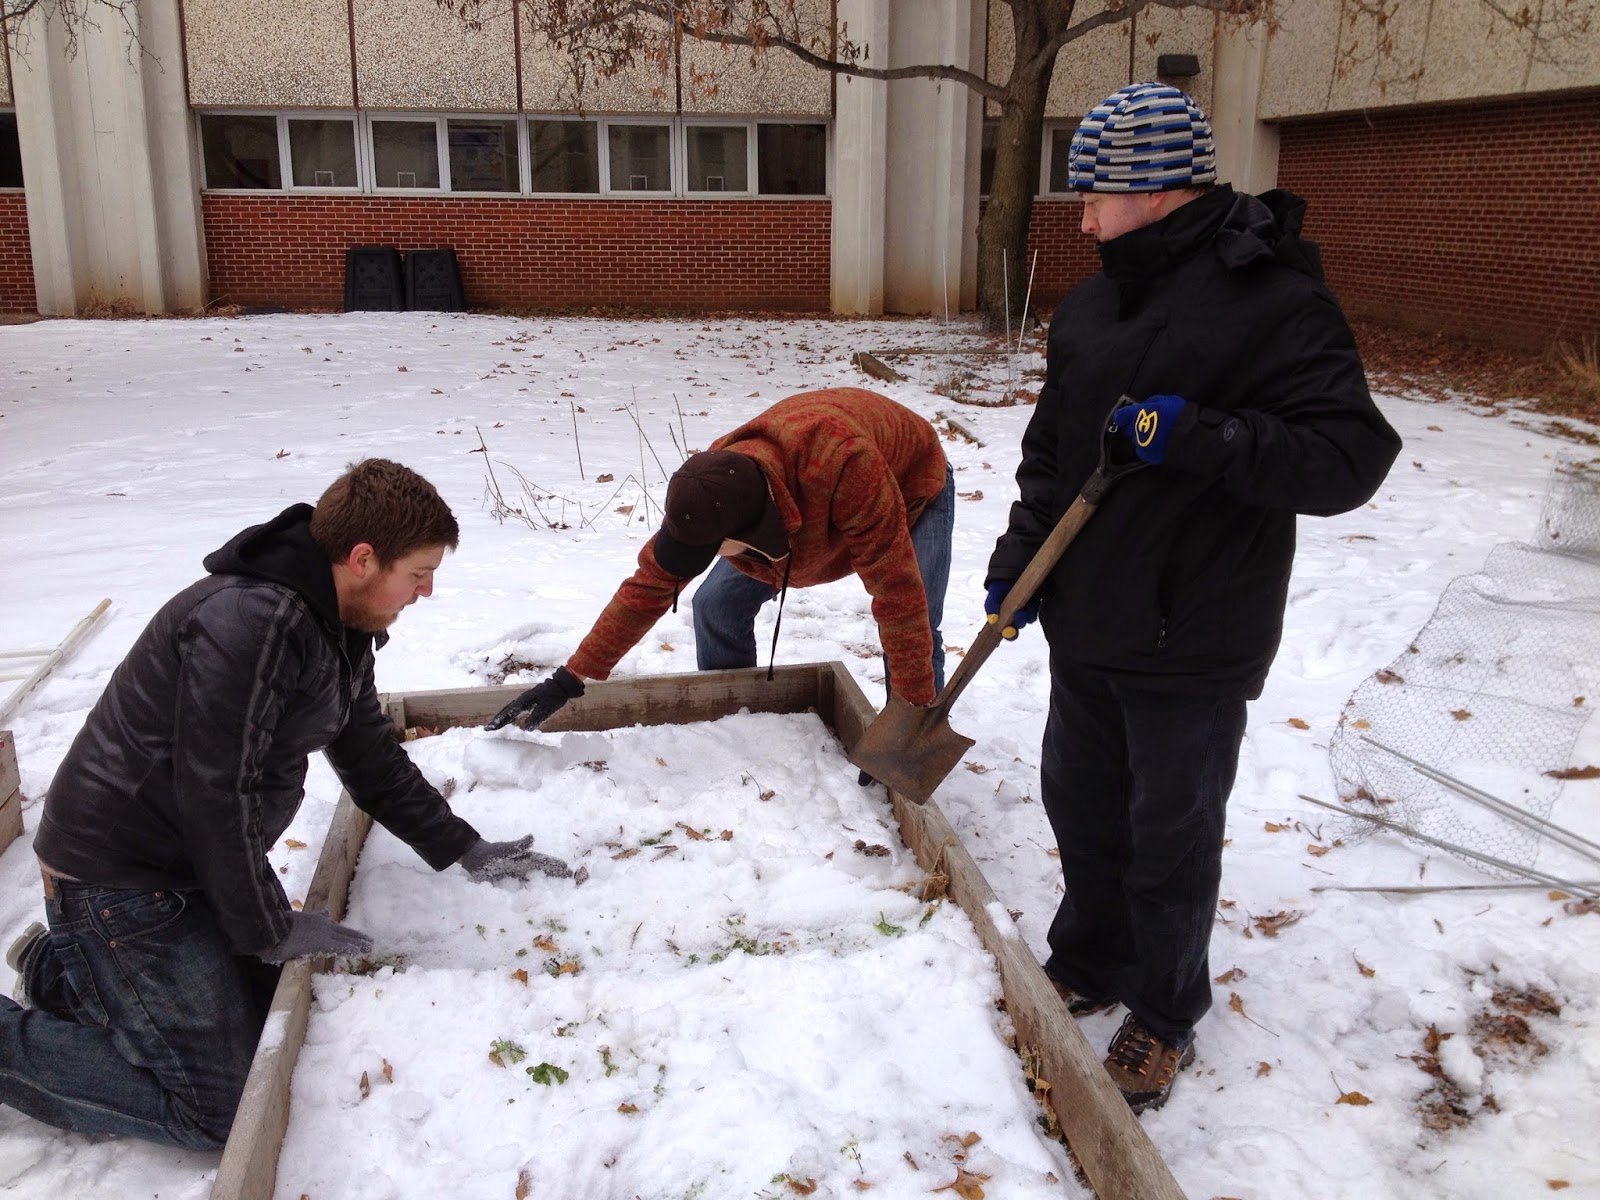 |
| Figure 1. An action shot of our group sculpting the terrain we developed on paper (Photograph by Zach Hilgendorf). |
 |
| Figure 2. A side view from slightly above the planter box. The image helps to give some idea of the topography of the terrain (Photograph by Zach Hilgendorf). |
 |
| Figure 3. A view from above the planter box shows the finished product. Each of the required landforms were included and are labeled in the picture (Photograph by Zach Hilgendorf). |
The next step was to develop a way to obtain elevation samples from the terrain in a consistent and uniform manner. We measured in ten centimeter increments and developed X and Y axes which originated from the same point. The X axis ranged from 0-23 and the Y axis ranged from 0-11. The result was a grid pattern of yarn and meter sticks. We did not have enough yarn to complete the entire grid pattern so the top four positions were measured from the last position of the yarn, using the method of sampling we developed (Figure 4). Every one of the ten by ten centimeter cells were sampled and recorded. We tried to record samples from the middle of each of the cells to maintain consistency. In total, two hundred and fifty-three samples were taken from the grid.
 |
| Figure 4. The pins along the edges mark out ten centimeter increments along the perimeter of the planter box. The meter sticks that appear vertically in this photograph were used when we ran out of yarn. Our "zero" point, where both the X and Y axis originate from, is in the top right corner of this picture. In this photograph, the bottom portion of the box appears empty and does not appear to be gridded out. We ran out of yarn and had to use the meter sticks and the placement of the thumbtacks on the side to properly sample those portions (Photograph taken by Zach Hilgendorf). |
The terrain was created in such a way that nothing was above the yarn we used to grid the planter box. This allowed for us to measure every point from the ground to where the yarn/meter stick crossed the stick we used to measure elevation with. Two very small portions were excluded from the grid. When the grid was created the cells in two edges were very small due to where the ten centimeter increments extended to. This meant that two edges, those opposite of our originating points, formed very small cells. We considered these cells to be negligible and no recordings were taken.
Results
All of the results are in negative numbers, as they measure the elevation from the top of our plane (the yarn/meter sticks) to the ground. The top of the plane is considered an elevation of zero centimeters (Figure 5).
 |
| Figure 5. The grid shows the raw elevation data for the terrain grid. The negative number in the orange background show the z-value from the string downward to the ground. |
Discussion
There are a number of small discrepancies that should be addressed that may slightly alter our results. As stated in the Methods section, two small sections were excluded. The small column and row that were excluded did not impact the rest of the grid and therefore were not necessary to represent the the terrain model we created. The method developed to measure elevation did have some inherent error. The plane that we measured elevation to, the level of the yarn/meter stick, was determined by the person measuring. This means there was some level of interpretation in the measuring of elevation. In order to minimize this error we did not change the person measuring our elevation. If we rotated this role there would most likely have been a significant change in interpretation. There was not much other room for error, as we made sure that the increments were accurate and all the numbers were accurately recorded.
Conclusion
Our next step will to be export our raw data as actual elevation measurements into a GIS and model our terrain. If our methods proved valid then our digital terrain model should very closely resemble the terrain we sculpted in the planter box. Critical thinking and improvisation were very necessary skills that our group needed to have in order to complete the first part of this exercise. These concepts hold true in the field as well. We will not always have set methods and standards that we are given in an instruction manual. The development of critical reasoning and the ability to improvise methods to meet the current goals of the job are crucial to furthering one's understanding.
No comments:
Post a Comment